
The Complete Browser Rendering Guide for 2026: Compositor, Property Trees & 120Hz Performance
You built a stunning sidebar navigation. On your M-series MacBook, it glides and feels native. Then you test it on a $200 Android device that is widely used. It stutters, the frame rate drops, and the interaction feels "heavy."
You check your JavaScript performance profile, but the code runs fast. You optimize loops, but the stutter remains.
The problem isn't your code's logic! The problem is a violation of the rendering pipeline's internal constraints.
To fix this, you don't need "better" JavaScript. You need to understand the mechanics of the rendering engine (e.g. Blink). This article dissects the Compositor Thread, Property Trees, and the Rasterization pipeline to show you exactly why some CSS is fast and why other CSS kills performance.
📌 Note on Browser Coverage: This article primarily focuses on Chromium's rendering architecture (Blink engine, RenderingNG). While many concepts apply broadly, specific implementation details like CompositeAfterPaint (CAP), Property Trees structure, and timing measurements are Chromium-specific. Firefox and Safari use different architectures with similar principles but different internal mechanisms.
Table of Contents
Core Concepts:
- Multi-Process Architecture - Understanding Main Thread vs Compositor
- The Rendering Pipeline - Style → Layout → Paint → Composite
- Property Trees - Why transform is fast
- Rasterization - GPU pixel generation
Modern Techniques:
- Scroll-driven Animations - CSS-only scroll effects
- CSS Containment - The most underutilized feature
- Texture Baking - Optimize expensive effects
Diagnostics & Reference:
- Performance Checklist - Common issues categorized
- DevTools Workflow - How to diagnose
- Browser Support - Compatibility matrix
New to rendering? Start with Multi-Process Architecture and Property Trees, then jump to the Checklist.
Need quick wins? Jump straight to the Quick Wins section below.
Quick Wins
If you're in a hurry, start with these. They take minutes to implement but have measurable impact:
Add passive listeners
element.addEventListener('touchstart', handler, { passive: true });Impact: Eliminates scroll jank on mobile
Use transform over layout properties
/* Bad */ left: 100px;
/* Good */ transform: translateX(100px);
Impact: 10-20× faster animations
Add content-visibility to lists
.list-item {
  content-visibility: auto;
  contain-intrinsic-size: 300px;
}
Impact: 5-10× faster initial render on long pages
Yield in long tasks
if (i % 50 === 0) await scheduler.yield();Impact: Reduces INP from 500ms → 100ms
See full diagnostic checklist →
The Multi-Process Architecture
We often hear that "JavaScript is single-threaded." This is true for your application logic, but the browser engine relies on a complex orchestration of parallel threads to put pixels on the screen.
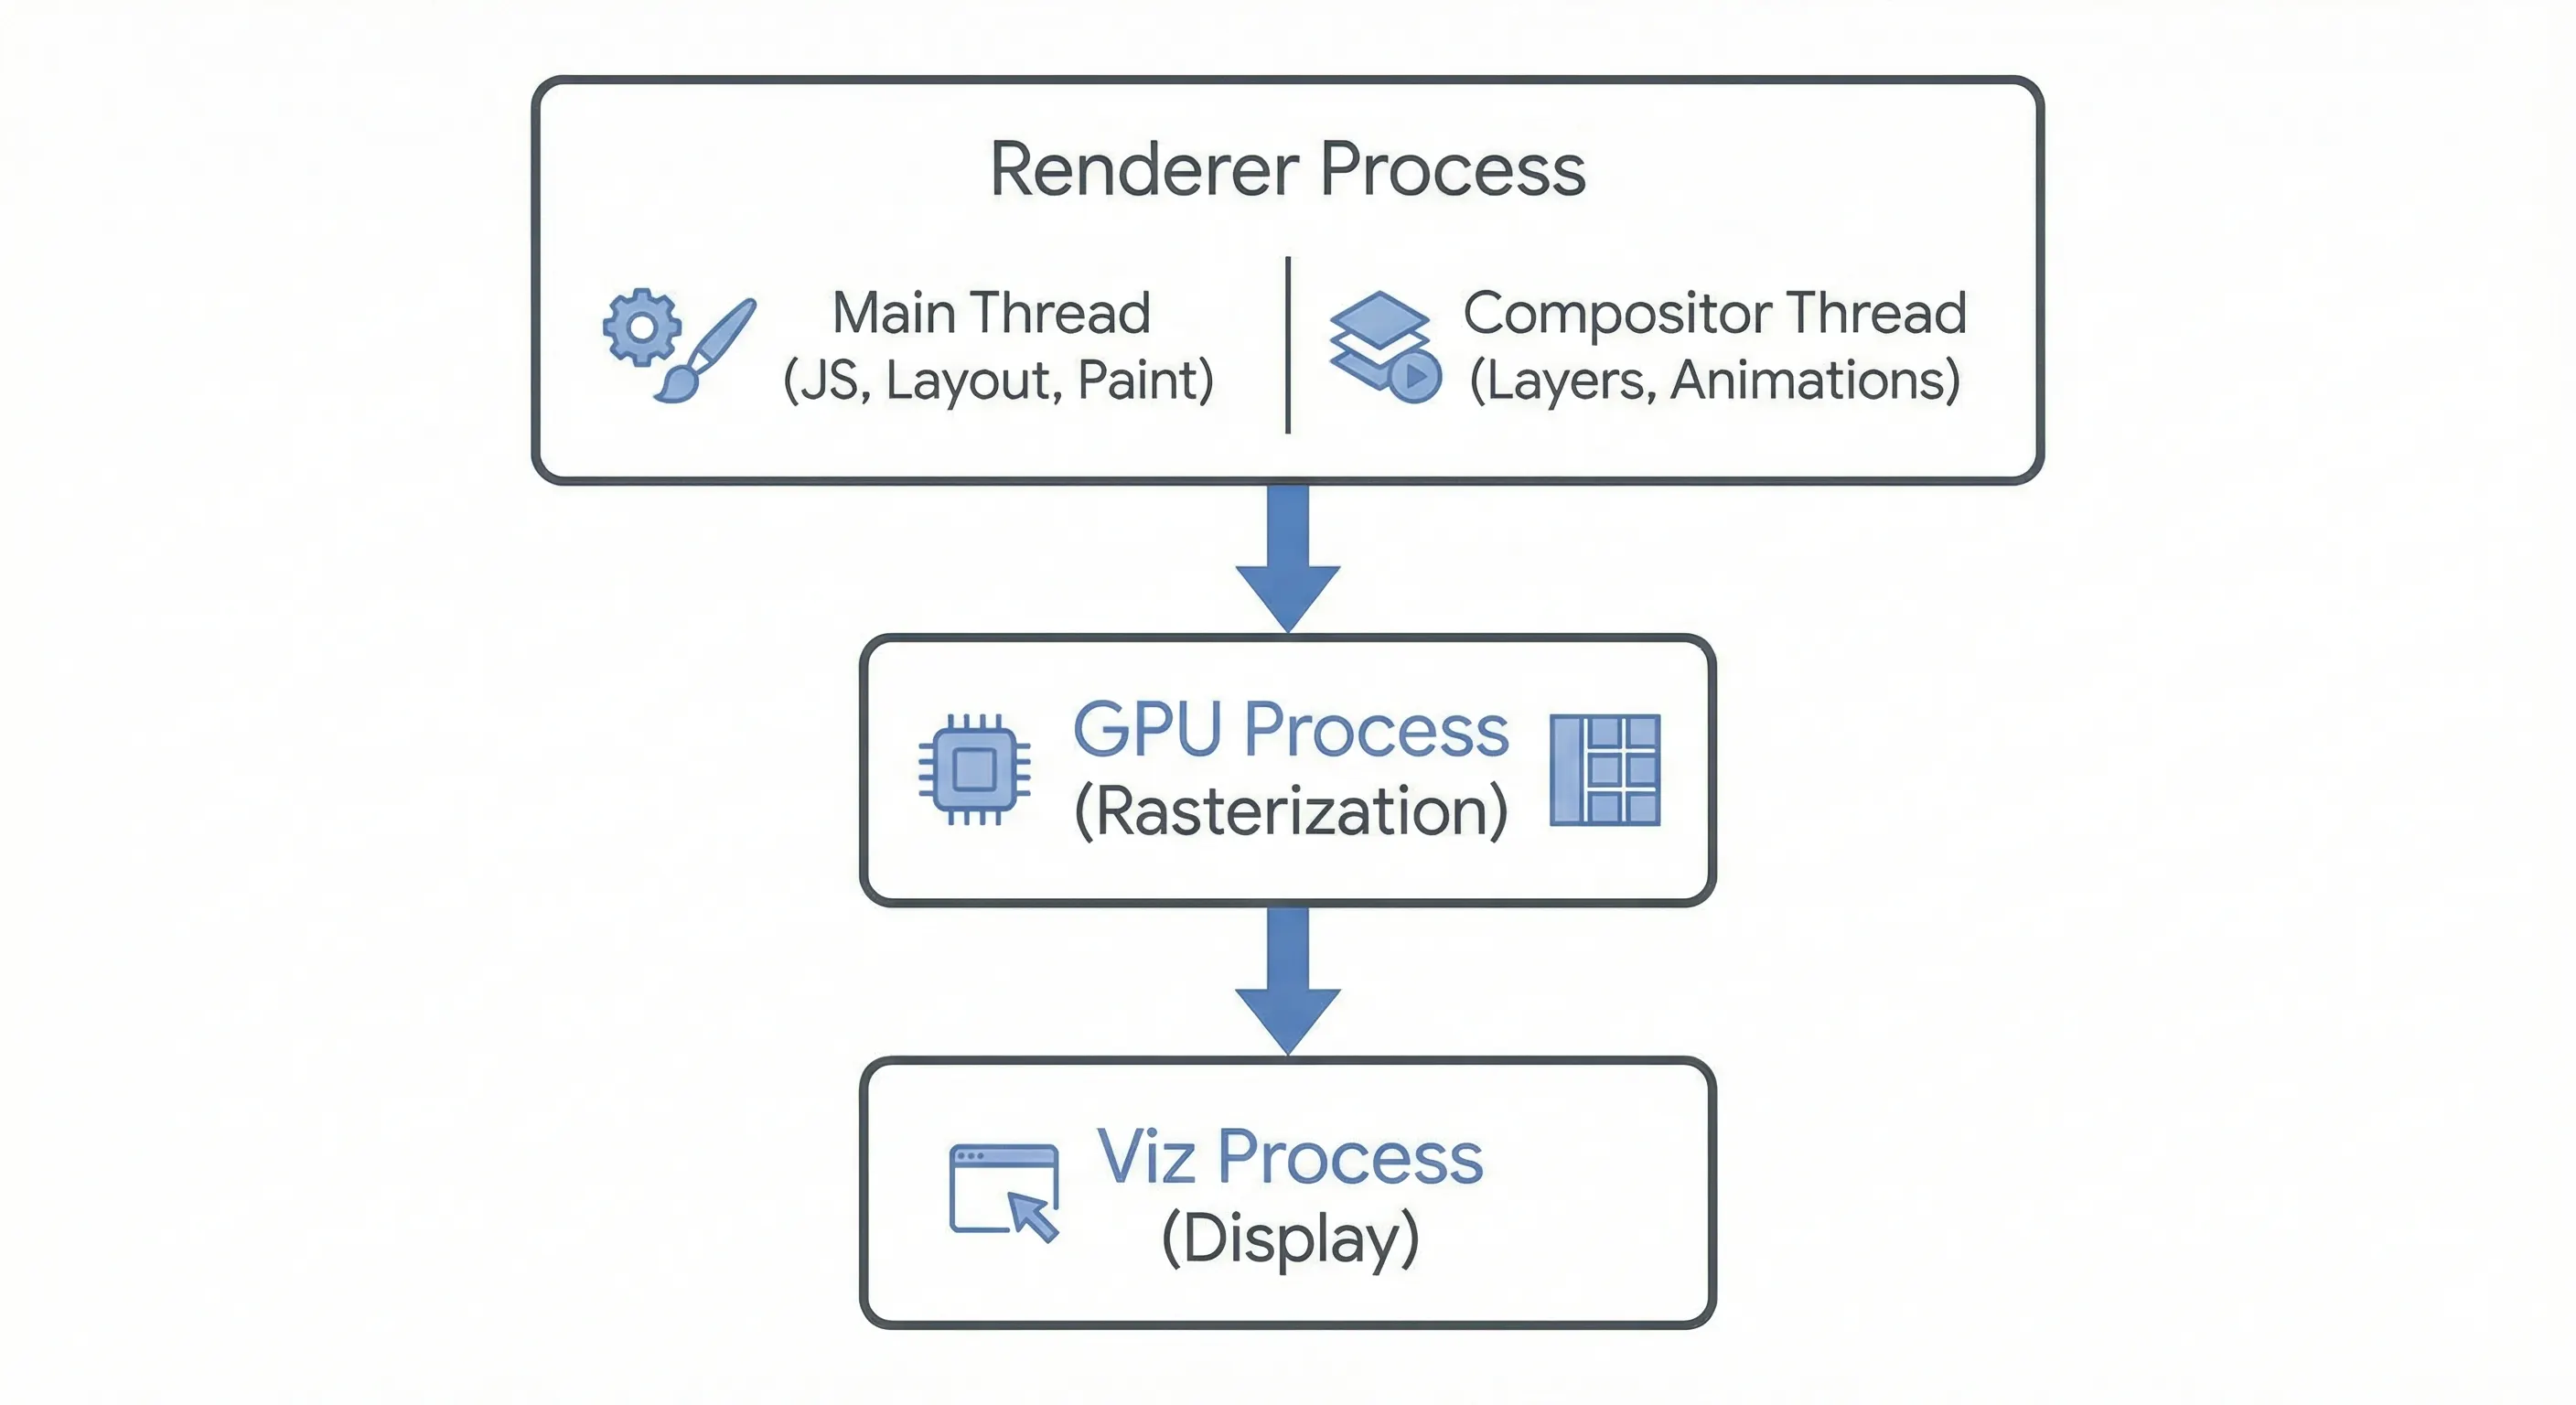
The two threads that define frontend performance are:
1. The Main Thread (The Manager)
This thread is the bottleneck. It runs your JavaScript, calculates CSS styles, computes geometry (Layout), and records painting instructions.
Modern mobile displays run at 120Hz (or higher). This gives you a strict frame budget.
The Real Frame Budget Breakdown:
For a 120Hz display, your 8.33ms budget is typically consumed as follows (varies by device/complexity):
- ~1-2ms: Compositor commit + VSync coordination
- ~1-2ms: Rasterization of invalidated tiles
- ~1ms: Paint (if triggered)
- ~2-3ms: Layout (if triggered - can be much higher!)
- Remaining ~2-4ms: Your JavaScript execution
Here's the thing: Layout operations can consume 5-10ms on complex DOMs, leaving almost no time for JavaScript. This is why "fast" JS still causes jank.
When your JS occupies the Main Thread for 50ms, the browser drops roughly 6 frames. This directly impacts your INP (Interaction to Next Paint) score because the Main Thread is blocked from processing user interactions.
Modern Scheduling We no longer just "optimize loops", we yield to the main thread.
⚠️ Scheduler API Status: The Scheduler API has limited browser support. scheduler.yield() is available in Chrome/Edge 129+ and Firefox 142+, but NOT in Safari. scheduler.postTask() is available in Chrome/Edge 94+ and Firefox 142+, also NOT in Safari. Always include feature detection and fallbacks for production use (shown below).
// Modern approach: scheduler.yield() (Chrome/Edge 129+, Firefox 142+)
async function heavyTask(items) {
  for (let i = 0; i < items.length; i++) {
    // Process batch
    processItem(items[i]);

    // Yield every 50 items or every 5ms
    if (i % 50 === 0) {
      await scheduler.yield();
    }
  }
}

// For fine-grained priority control (Chrome/Edge 94+, Firefox 142+)
async function criticalTask() {
  await scheduler.postTask(() => {
    // High priority work
  }, { priority: 'user-blocking' });
}

// Fallback for older browsers
async function yieldToMain() {
  if ('scheduler' in window && 'yield' in scheduler) {
    return scheduler.yield();
  }
  // Fallback: next microtask + setTimeout
  return new Promise(resolve => {
    setTimeout(resolve, 0);
  });
}
Why scheduler.yield() is superior to setTimeout():
- setTimeout(fn, 0): Pushes your task to the back of the macro-task queue. If 20 analytics scripts are queued, your task waits behind all of them (potential 100ms+ delay).
- scheduler.yield(): Yields control to the browser's Scheduler API. The browser processes high-priority work (rendering, input) then resumes your task with continuation priority (inherits the priority of the calling task).
- scheduler.postTask(): Allows explicit priority levels:
user-blocking(input handlers),user-visible(rendering updates),background(analytics).
2. The Compositor Thread (The Specialist)
This thread is your performance guarantee. It operates independently of the Main Thread within the Renderer Process. Its primary jobs are:
- Input Handling: For async-composited scrolling, it is the first rendering thread to receive touch, scroll, and mouse events.
- Orchestration: It manages visual layers, maintains Property Trees, and submits "Compositor Frames" to the Viz Process (the GPU display compositor) for final drawing.
- Independent Animation: Can animate
transformandopacitywithout touching the Main Thread. Some filters can be animated compositor-only if already rasterized, but complex filters (blur, drop-shadow) require re-rasterization.
When the Compositor blocks
While the Compositor is designed to run independently, it can be blocked:
Non-Passive Event Listeners: If you attach
touchstart,touchmove, orwheellisteners without{ passive: true }, the Compositor must wait for the Main Thread to check ifpreventDefault()was called. If the Main Thread is busy executing JS, scrolling freezes.Common mistake: Forgetting
{ passive: true }on element-level touch listeners. Document-level listeners are passive by default in modern browsers, but element listeners are not.Main Thread Commit: During the "Commit" phase, the Compositor briefly waits for the Main Thread to send updated Property Trees and Display Lists. Large layer trees make this handoff expensive. [See detailed explanation in Commit section below]
GPU Bottleneck: If the GPU Process is overwhelmed (complex shaders, too many layers, memory pressure), the Compositor must wait for rasterization to complete.
Passive Event Listener Rules:
// ❌ BAD: Blocks Compositor (non-passive by default in older browsers)
element.addEventListener('touchstart', handler);

// ✅ GOOD: Compositor handles scroll immediately
element.addEventListener('touchstart', handler, { passive: true });

// Note: As of Chrome 56, these are passive by default for document-level listeners:
// - touchstart, touchmove (on document/body)
// - wheel, mousewheel (on document/body)
// But element-level listeners still require explicit { passive: true }Rule: Always explicitly mark scroll/touch/wheel listeners as { passive: true } unless you genuinely need preventDefault() (e.g., custom gesture handling).
The Rendering Pipeline
When you update the DOM or CSS, Blink runs a strict pipeline known as the Lifecycle. Understanding this order reveals why some properties are "expensive" (trigger early steps) and others are "free."
1. Style (The Recalculation Phase)
- Triggers: Adding/removing classes, changing CSS variables,
:hoverstates, inline style modifications. - The Work: The browser matches CSS selectors to DOM nodes, resolving cascaded values and computed styles.
- The Cost: High. Complexity is O(n × m) where n = affected DOM nodes and m = number of matching selectors. Changing a class on
<body>can force a full-tree style recalculation (10,000+ nodes on complex pages). - Optimization: Use scoped CSS variables, BEM methodology (low specificity), and avoid universal selectors (
*) or deep descendant combinators (body div p span).
/* ❌ BAD: Forces re-matching across entire tree */
body.dark-mode * { color: white; }

/* ✅ GOOD: Scoped to subtree */
.dark-mode { --text-color: white; }
.text { color: var(--text-color); }
2. Layout (The Geometry Phase)
- Triggers:
width,height,margin,padding,border,display,font-size,position,top,left,right,bottom,float,clear,white-space. - The Work: The browser calculates exact coordinates and box sizes to build the Layout Tree (specifically, the LayoutObject tree).
- The Cost: Very High. Layout is recursive. A change to one element's width often forces re-calculation of its children and siblings (Layout Propagation). On a 5,000-node DOM, layout can take 5-15ms.
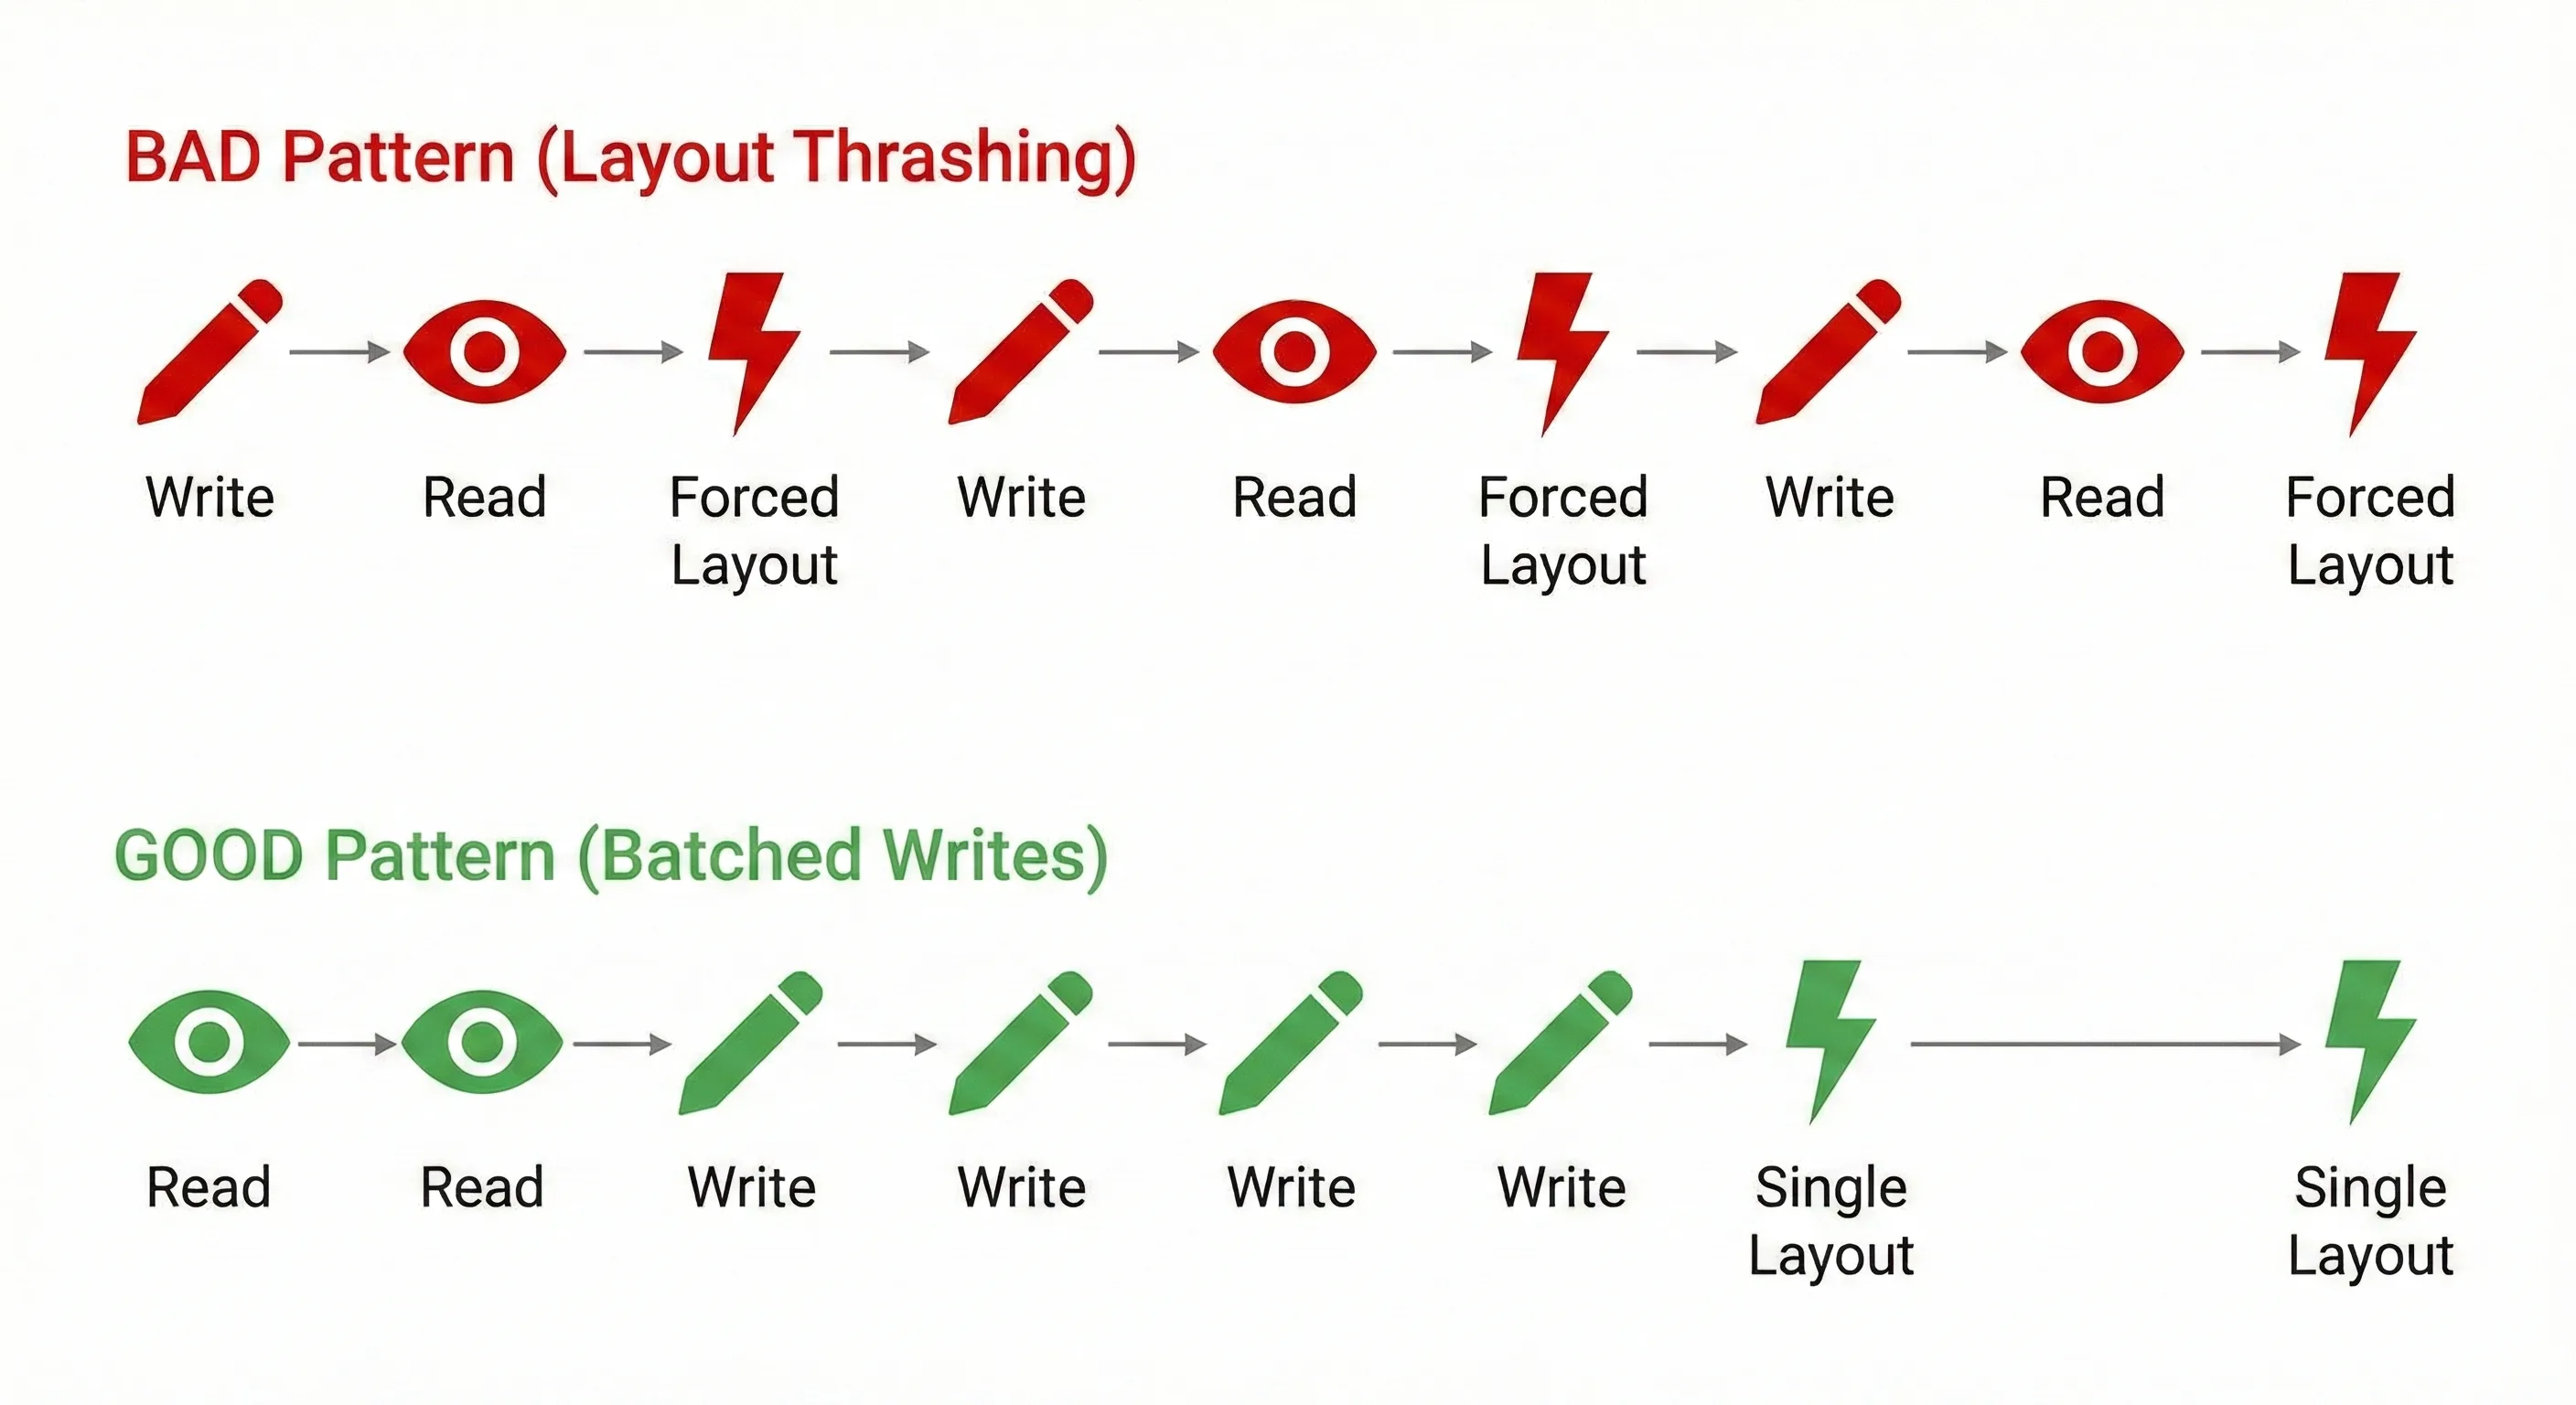
The Trap: Forced Synchronous Layout (Layout Thrashing)
Reading geometric properties immediately after writing them forces the browser to pause JS, execute Layout synchronously, then resume JS:
// ❌ BAD: Write-Read-Write pattern (3 forced layouts!)
const element = document.querySelector('.box');
element.style.width = '100px';           // Write (schedules layout)
const height = element.offsetHeight;     // Read (FORCES layout NOW)
element.style.height = height + 'px';    // Write (schedules layout again)
const width = element.offsetWidth;       // Read (FORCES layout NOW)
element.style.margin = width + 'px';     // Write

// ✅ GOOD: Batch reads, then batch writes (1 layout)
const element = document.querySelector('.box');
const height = element.offsetHeight;     // Read (forces 1 layout)
const width = element.offsetWidth;       // Read (cached)
element.style.width = '100px';           // Write (batched)
element.style.height = height + 'px';    // Write (batched)
element.style.margin = width + 'px';     // Write (batched)
// Browser runs layout once at end of task

// 🚀 BEST: Use transform instead
element.style.transform = 'scale(1.5)';  // Compositor-only, no layout!
Properties that trigger Forced Synchronous Layout when read:
offsetTop, offsetLeft, offsetWidth, offsetHeight, clientWidth, clientHeight, scrollTop, scrollLeft, getComputedStyle(), getBoundingClientRect().
Pro Pattern: Use FastDOM or similar libraries to automatically batch reads/writes.
3. PrePaint (The Property Tree Builder)
Property Trees are parallel data structures that store transform/clip/effect information separately from layout. This is why transform and opacity animations don't trigger layout recalculation, the Compositor updates tree nodes directly on the GPU.
- Triggers:
transform,opacity,overflow,clip-path,filter,backdrop-filter,mask,mix-blend-mode,isolation,contain. - The Work: This is the critical modern step. The browser walks the Layout Tree to construct Property Trees, a parallel data structure that decouples "What to draw" (Paint) from "How to transform/clip/blend it" (Compositor).
The Four Property Trees:
Transform Tree: Stores cumulative 4×4 transformation matrices for each element. When you animate
transform: translateX(100px), the Compositor updates a single matrix in this tree without recalculating the entire layout.Clip Tree: Tracks the intersection of all ancestor
overflow: hidden,clip-path, andclipregions. Allows GPU-side clipping without re-rasterizing content.Effect Tree: Manages opacity, filters (
blur,drop-shadow), blend modes, and backdrop filters. Effects are composited as post-processing on existing textures.Scroll Tree: Represents nested scroll containers. Enables Compositor-driven scrolling, your JS scroll handlers execute async while the Compositor updates scroll offsets at native refresh rate.
Why This Matters:
/* When you write this: */
.element {
  transform: translateX(100px);
  opacity: 0.5;
  clip-path: circle(50%);
}

/* The browser creates:
   - 1 node in Transform Tree (matrix: translate(100, 0, 0))
   - 1 node in Effect Tree (alpha: 0.5)
   - 1 node in Clip Tree (circle clip region)
*/

/* Later, when you animate: */
.element { transform: translateX(200px); }

/* The Compositor only updates the Transform Tree node's matrix.
   NO Layout, NO Paint, NO Rasterization.
   The GPU draws the same cached texture at a new position. */
Here's why this matters: transform and opacity modify Property Tree nodes on the Compositor Thread. Properties like width rebuild the Layout Tree on the Main Thread, an entirely different, more expensive operation.
4. Paint (The Recorder)
- Triggers: background, color, shadow, border-radius.
- The Work: The browser creates a list of Paint Ops (vector instructions like drawRect, drawText).
- Crucial Concept: Paint does not create pixels yet. It creates a "Display List" of resolution-independent vector commands.
5. Layerize (Composite After Paint - CAP)
Unlike older browser architectures where layering decisions happened BEFORE painting, CompositeAfterPaint (CAP) analyzes the already-painted Display List to determine which portions need dedicated GPU layers. Layerization is an OUTPUT of dependency analysis, not an INPUT to the painting process.
This architectural shift allows the browser to avoid creating unnecessary layers for static content while automatically promoting content that will benefit from GPU acceleration based on actual rendering requirements, not just CSS hints.
- The Work: After Paint completes, the Paint Artifact Compositor (PAC) performs dependency analysis on Paint Ops and Property Trees. It groups paint operations into Paint Chunks, then decides which chunks to promote to dedicated Composited Layers based on:
- Actual rendering requirements (transforms, opacity changes)
- Overlap analysis (stacking context requirements)
- Performance heuristics (animation likelihood, scrollability)
Compositing Reasons (when browsers auto-promote to layers):
- Active
transform,opacity,filteranimations (via CSS animations/transitions) will-change: transform | opacity | filter- 3D transforms (
translateZ,rotateX, etc.) <video>,<canvas>,<iframe>elements- Elements with
position: fixedon mobile (to enable Compositor-side scrolling) - Overlap with an existing composited layer (stacking context requirements)
The Modern will-change Best Practices:
/* ❌ BAD: Permanent will-change (wastes VRAM) */
.card {
  will-change: transform;  /* Layer exists 24/7, even when idle */
}

/* ✅ GOOD: Apply on-demand, remove after animation */
.card {
  transition: transform 0.3s;
}
.card:hover, .card:focus {
  will-change: transform;  /* Layer created only during interaction */
  transform: scale(1.05);
}
/* 🚀 BETTER: Use JS to add/remove will-change, on container-level events */
container.addEventListener('mouseenter', () => {
card.style.willChange = 'transform';
});
container.addEventListener('animationend', () => {
card.style.willChange = 'auto'; // Free VRAM immediately
});The Layer Explosion Problem:
Each Composited Layer consumes:
- VRAM: Typically 4-8MB per full-screen layer (4K texture)
- CPU/GPU cycles: Commit time, texture upload, composition overhead
On mobile devices with 512MB GPU memory, 50 layers = 200-400MB. The browser will:
- Throttle layer creation (ignoring
will-change) - Show checkerboarding (white flashes)
- Crash the tab (out of memory)
How to Audit Layers:
- Chrome DevTools → Layers panel → See all composited layers
- [cmd/ctrl - shift - p] → Show Rendering -> Enable "Layer borders" → Yellow borders indicate layers
Rule: Only use will-change on elements that will ACTUALLY animate soon. Remove it after the animation completes. Modern browsers are smart, they often don't need your hints.
6. Commit (The Critical Handoff)
The Commit phase is a synchronous bottleneck. It's a handshake between Main Thread and Compositor Thread, neither thread can proceed until both are ready and data transfer completes.
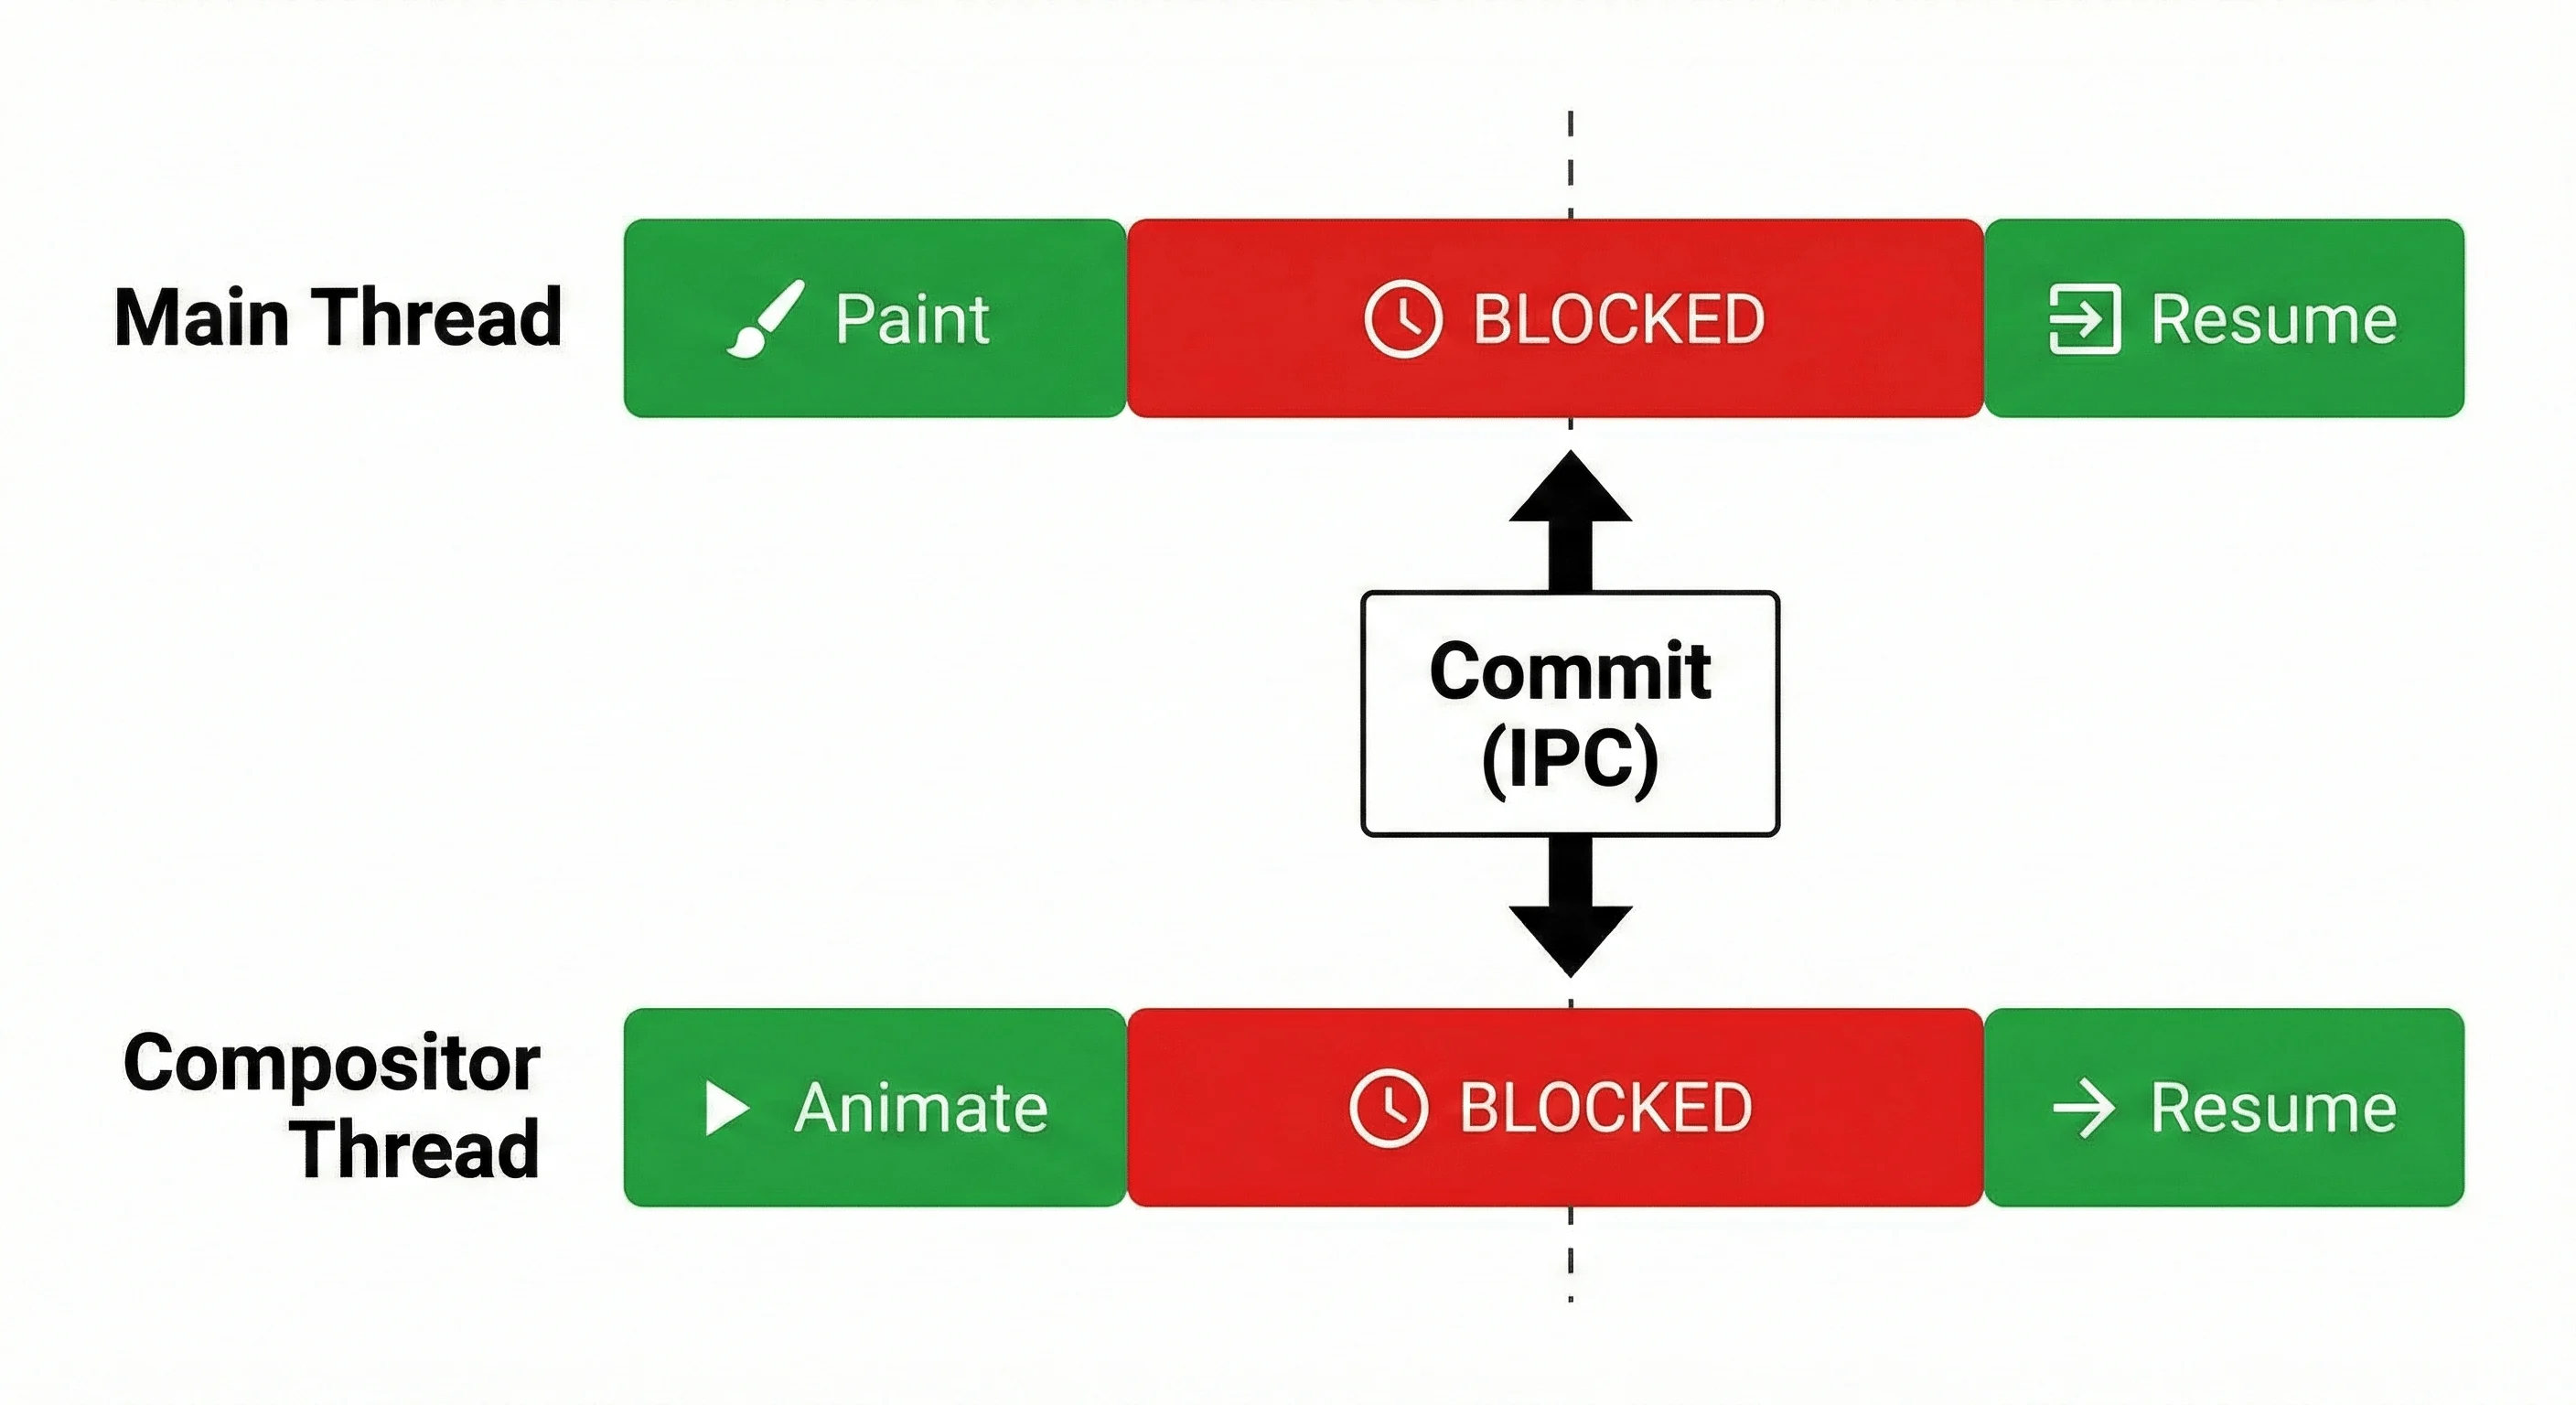
How It Works:
- Main Thread finishes Paint/Property Trees
- Main Thread blocks and waits for Compositor to acknowledge readiness
- Compositor blocks and waits for Main Thread to send data
- Property Trees and Display Lists transfer via IPC (Inter-Process Communication)
- Both threads resume independent work
Typical Commit Time:
- Small page (10 layers): ~0.5-1ms
- Medium page (30 layers): ~1-2ms
- Large page (50+ layers): ~2-5ms (danger zone)
Why this kills compositor-driven scroll:
Even if your scroll uses passive: true listeners and compositor-only transform animations, a long JavaScript task will still cause jank:
// User scrolls (Compositor handles it smoothly)
// But then your code runs:
heavyComputation(); // Blocks Main Thread for 500ms

// During those 500ms:
// ❌ Main Thread cannot prepare the next frame's data
// ❌ Compositor CAN animate the current frame
// ❌ But Compositor CANNOT get new frame data (Commit is blocked)
// ❌ After ~16ms, scroll position updates but content is stale
// ❌ Result: Visible stutter/jank (content "catches up" in jumps)
Here's what happens:
Long JS Task (50ms)
→ Main Thread blocked from Layout/Paint
→ Commit phase delayed
→ Compositor waits idle (cannot get new frame)
→ Even compositor-only animations jank
To fix this:
- Use
scheduler.yield()every 5ms or 50 iterations - Keep Main Thread responsive so Commit can happen every 8-16ms
- Monitor "Commit" time in Performance panel (should be <2ms)
Pro tip: This is why content-visibility: auto is so powerful, it reduces the amount of data the Main Thread must prepare for Commit, making the handoff faster.
The 8.33ms frame budget (120Hz) includes ~1-2ms for Commit. Large layer trees or complex Property Trees make Commit expensive, stealing time from JavaScript and Layout.
To recap:
- Style recalc is O(n × m) - use scoped CSS
- Layout is recursive and expensive - use
transforminstead - Property Trees enable compositor-only animations
- Paint creates vector commands, not pixels
- CAP analyzes painted content to decide layering (not before)
- Commit is a synchronous handshake, long JS blocks it, causing jank
Rasterization
Frontend engineers confuse Paint and Rasterization constantly. Here's the distinction:
- Paint (Main Thread): Records vector instructions (DrawRect, DrawText). This is fast (1-3ms).
- Rasterization (GPU Process): Executes those instructions to fill pixels. This can be slow (5-20ms for complex effects).
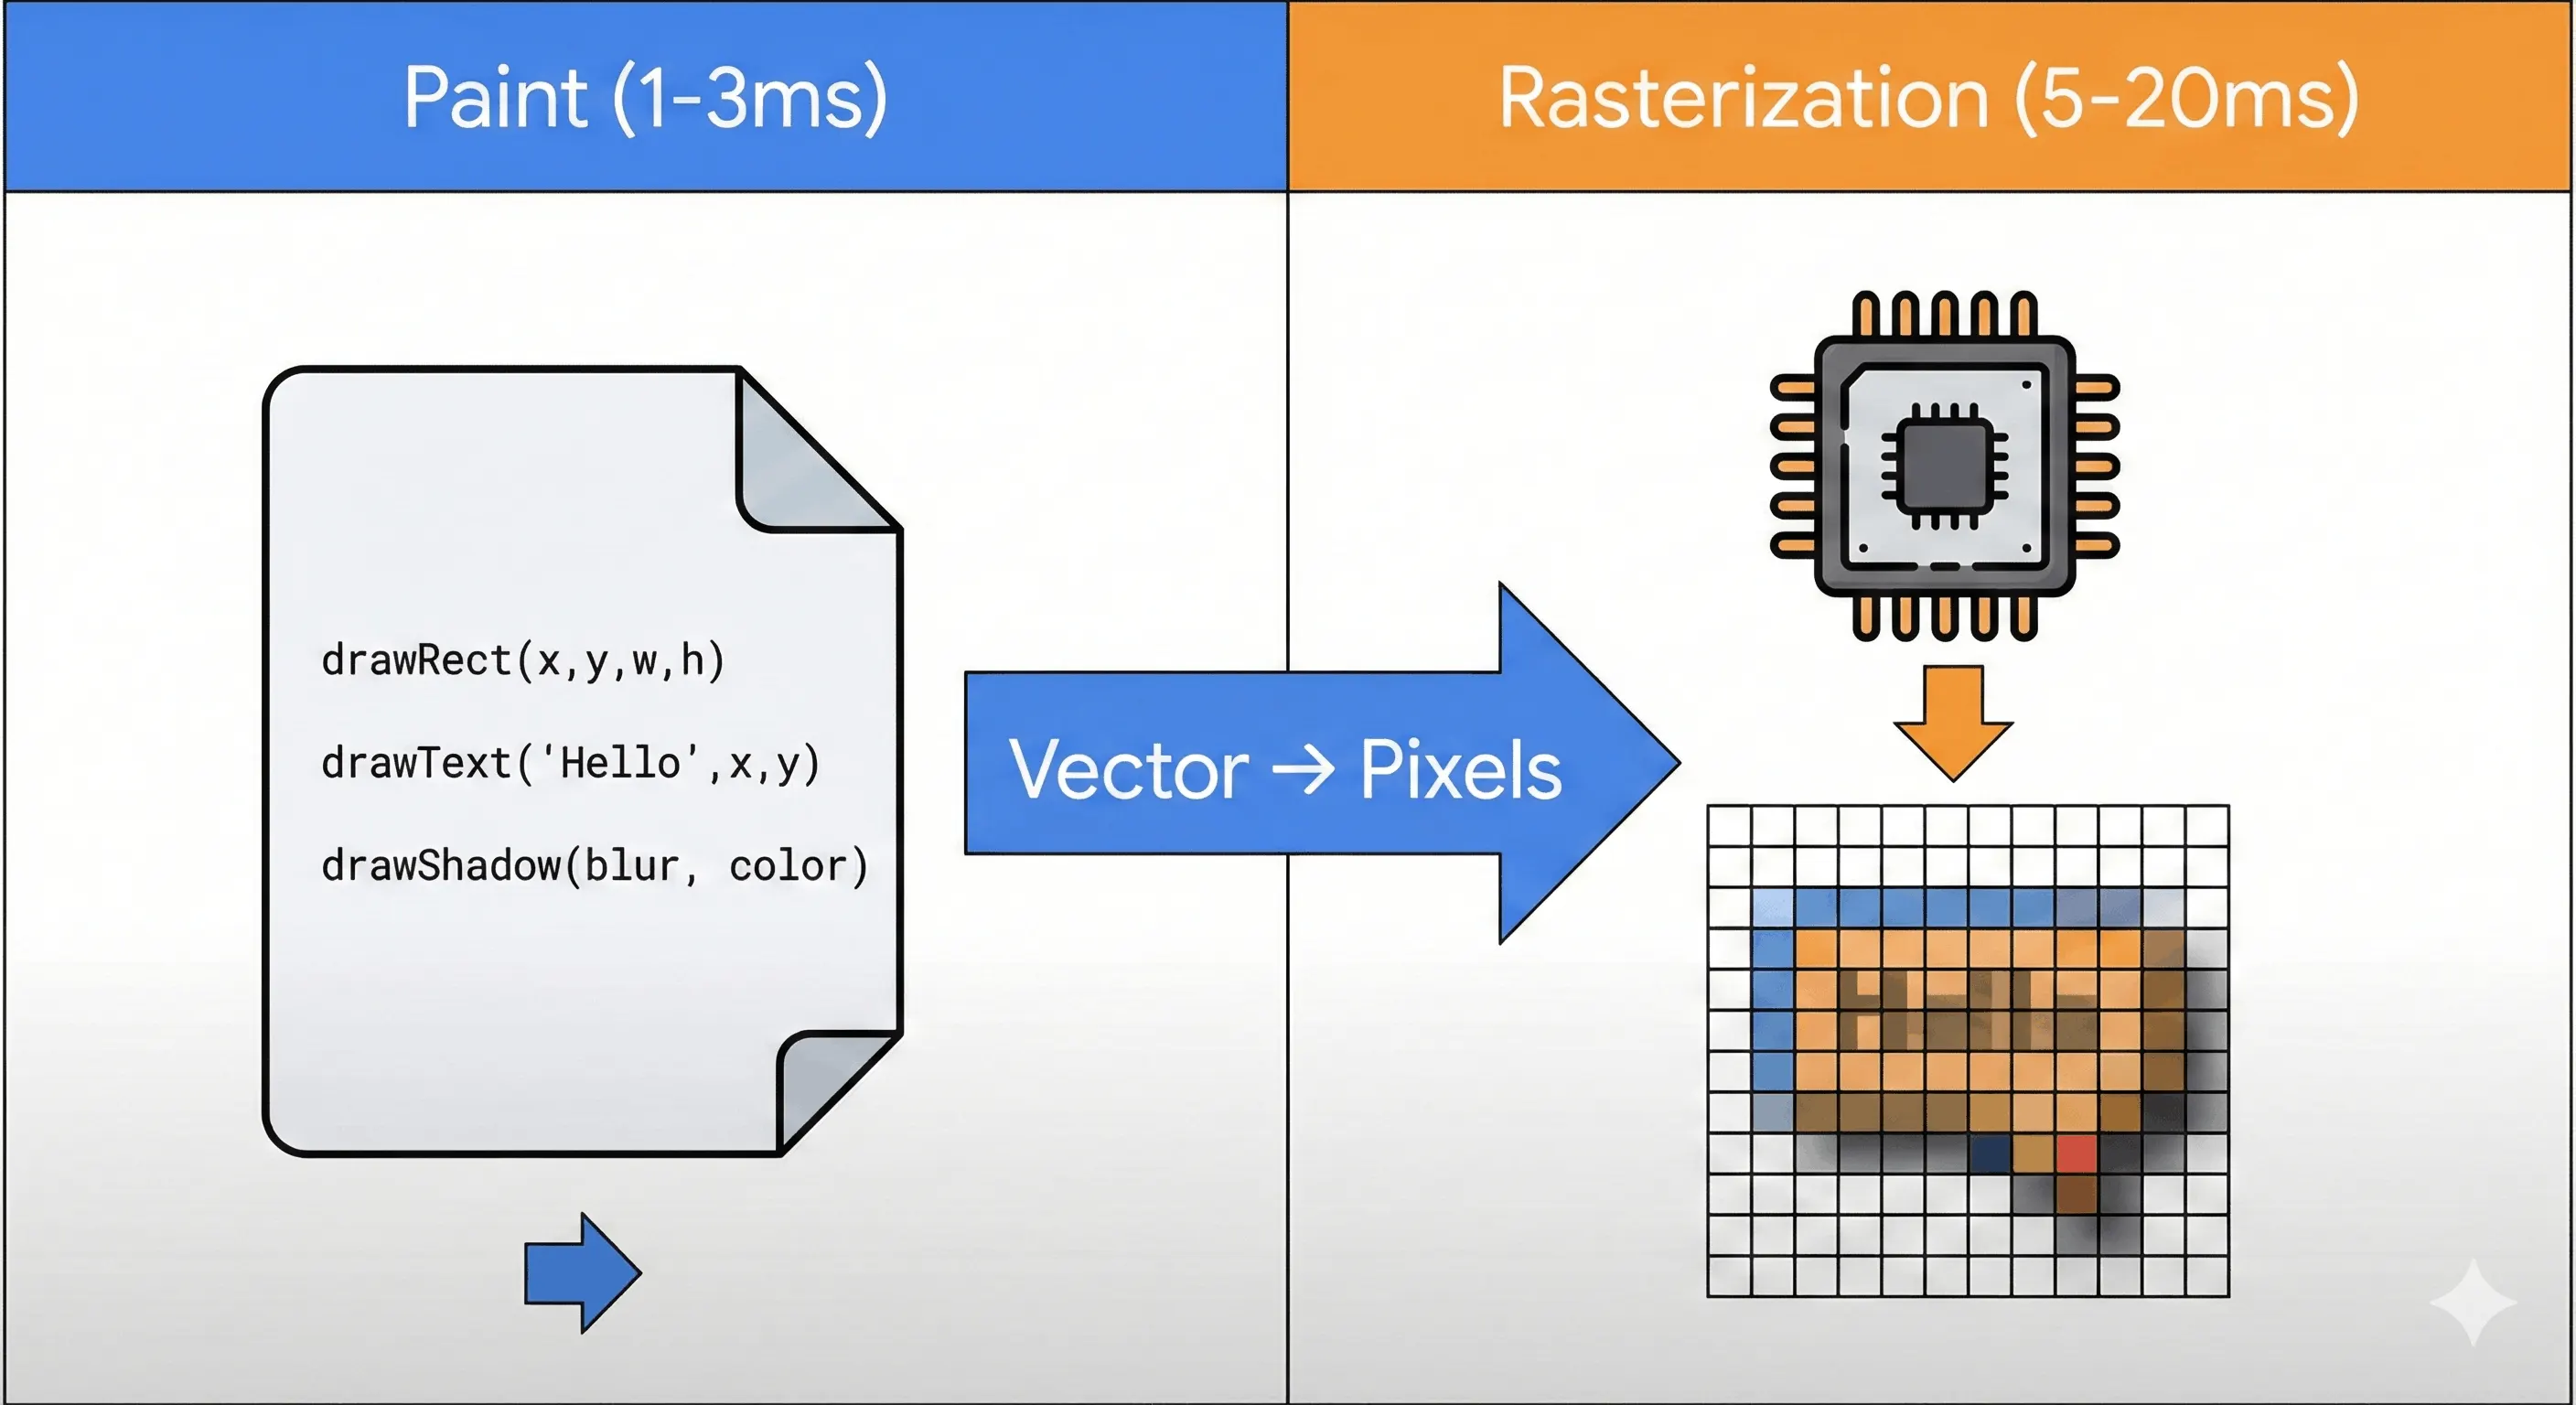
Why this matters: When you animate box-shadow, you're not re-"painting" it, the vector command (drawShadow(...)) is the same. You're re-rasterizing it, forcing the GPU to execute expensive blur shaders every frame at 120Hz.
This distinction is the foundation of all rasterization optimizations below.
Once the Compositor receives the committed data, it divides each Composited Layer into Tiles. Tile size is browser and device-dependent:
- Chrome on mobile: Typically 256×256 pixels
- Chrome on desktop: 512×512 or larger (adaptive based on zoom level)
- Safari: Uses different heuristics, often 256px tiles but varies by device
The Compositor then submits these tiles to the GPU Process via OOP-R (Out-of-Process Rasterization). The GPU executes the Paint Ops (vector drawing commands) to generate bitmaps (textures).
Rasterization Caching
Critical Optimization: Modern browsers cache rasterized tiles aggressively. If a tile's Paint Ops haven't changed, the cached texture is reused. This is why:
/* This is fast (static shadow, rasterized once): */
.card {
  box-shadow: 0 4px 8px rgba(0,0,0,0.2);
  animation: slide 1s;
}
@keyframes slide {
  to { transform: translateX(100px); }  /* Only transform changes */
}

/* This is SLOW (shadow changes every frame, re-rasterizes constantly): */
.card {
  animation: pulse-shadow 1s infinite;
}
@keyframes pulse-shadow {
  0%, 100% { box-shadow: 0 4px 8px rgba(0,0,0,0.2); }
  50%      { box-shadow: 0 8px 16px rgba(0,0,0,0.4); }  /* Forces re-raster */
}
The "Expensive Shader" Problem
Not all Paint Ops cost the same to rasterize:
- Cheap:
background: blue, solid colors, simple borders → GPU fill operations - Moderate:
border-radius, linear gradients → Multiple fill passes - Expensive:
box-shadow,filter: blur(),backdrop-filter→ GPU Fragment Shaders must sample and blend many neighboring pixels (10-50+ samples per pixel)
Example Cost Comparison (approximate GPU time per tile):
- Solid color: 0.1ms
- Border-radius: 0.3ms
- Box-shadow: 2-5ms
- Blur filter (10px): 5-10ms
- Backdrop-filter: 10-20ms (requires background layer sampling)
When you animate box-shadow or filter: blur(), the browser must:
- Invalidate affected tiles
- Re-submit Paint Ops to GPU
- Re-execute expensive shaders
- Upload new textures to VRAM
At 120Hz, this becomes a bottleneck.
The Pro Tip: Texture Baking
Never animate the box-shadow property directly. Instead, bake the shadow into a texture, then animate the texture's opacity:
/* ❌ BAD: Re-rasterizes shadow every frame */
.card {
  animation: pulse-shadow 1s infinite;
}
@keyframes pulse-shadow {
  0%, 100% { box-shadow: 0 4px 8px rgba(0,0,0,0.2); }
  50%      { box-shadow: 0 8px 16px rgba(0,0,0,0.4); }
}

/* ✅ GOOD: Shadow rasterized once, animate opacity */
.card {
  box-shadow: 0 8px 16px rgba(0,0,0,0.4);
  position: relative;
}
.card::after {
  content: '';
  position: absolute;
  inset: 0;
  box-shadow: 0 8px 16px rgba(0,0,0,0.4);
  opacity: 0;
  animation: pulse-opacity 1s infinite;
  /* Force layer promotion for compositor-only animation */
  will-change: opacity;
}
@keyframes pulse-opacity {
  50% { opacity: 1; }
}
Critical Requirements for Texture Baking:
Element Size Must Be Static: If the element resizes, the shadow texture must be re-rasterized. This technique only works for fixed-size elements or where size changes trigger acceptable re-rasters.
Pseudo-Element Must Be Its Own Layer: The
::aftermust be promoted to a composited layer (viawill-change: opacity, active animation, ortransform: translateZ(0)). Otherwise, animating its opacity still triggers Paint on the Main Thread.Use
isolation: isolatefor Complex Stacking: If your element has complex children or stacking contexts, wrap it:
.card-wrapper {
  isolation: isolate;  /* Creates stacking context boundary */
}
.card {
  box-shadow: 0 4px 8px rgba(0,0,0,0.2);
}Result: The expensive box-shadow shader runs once during rasterization. The animation becomes a simple alpha-blend operation (multiplying texture by opacity value), which modern GPUs execute in <0.1ms.
**To recap:**
- Paint != Rasterization: Paint records commands (fast), Raster fills pixels (slow)
- Tiles are rasterized in GPU Process (OOP-R)
- Cached textures are reused when Paint Ops unchanged
box-shadowandblurare expensive shaders (5-20ms)- Texture baking: Pre-render expensive effects, animate opacity
Composition
Now, the Compositor acts as the conductor. It has the Textures (from Rasterization) and the Property Trees (from PrePaint).
When you run transform: scale(2) or opacity: 0.5:
- No Layout: The Main Thread remains idle.
- No Paint/Raster: The pixels are not redrawn.
The Cheat: The Compositor simply updates a pointer in the Transform Node of the Property Tree. The Viz Process draws the exact same texture it painted 5 seconds ago, but maps it onto a Quad (geometry) that is now mathematically scaled larger.
The Modern Standard: Scroll-driven Animations
CSS Scroll-driven Animations bind animation progress to scroll position directly in the Compositor. No JavaScript, no Main Thread blocking, 120Hz smooth scrolling even during heavy JS tasks.
In the past, syncing animation to scroll required JavaScript (Main Thread) or complex Animation Worklets. Since 2024, CSS Scroll-driven Animations are production-ready and solve this elegantly.
.progress-bar {
  /* Links animation progress to scroll position of nearest scroller */
  animation: grow-bar linear;
  animation-timeline: scroll();  /* Compositor-driven */
}

@keyframes grow-bar {
  from { transform: scaleX(0); }
  to { transform: scaleX(1); }
}

/* Advanced: Scroll-linked parallax */
.hero {
  animation: parallax linear;
  animation-timeline: scroll();
}

@keyframes parallax {
  to { transform: translateY(-100px); }
}

/* View-based animations (element enters viewport) */
.fade-in {
  animation: fade linear;
  animation-timeline: view();  /* Triggers when element enters view */
  animation-range: entry 0% entry 100%;
}

@keyframes fade {
  from { opacity: 0; transform: translateY(20px); }
  to { opacity: 1; transform: translateY(0); }
}
How It Works:
This creates a direct binding in the Compositor's Scroll Tree (one of the Property Trees). When you scroll:
- The Compositor reads the scroll offset directly (no Main Thread involvement)
- Updates the animation progress based on scroll position
- Modifies the Transform/Effect Tree nodes
- The GPU composites the result
Benefits:
- Main Thread: Completely idle (no JS scroll handlers)
- Frame Rate: Locked to display refresh rate (120Hz), even if Main Thread is blocked
- No Jank: Scroll and animation are perfectly synchronized
- Battery Efficient: No Wake-locks or JS polling
Fallback Strategy (for older browsers):
if (!CSS.supports('animation-timeline: scroll()')) {
  // Fallback to IntersectionObserver + CSS classes
  const observer = new IntersectionObserver((entries) => {
    entries.forEach(entry => {
      if (entry.isIntersecting) {
        entry.target.classList.add('visible');
      }
    });
  });
  document.querySelectorAll('.fade-in').forEach(el => observer.observe(el));
}
CSS Containment
CSS Containment is probably the most underutilized performance feature in modern browsers. It tells the browser: "This element's internal layout/paint is independent, you can skip checking it during rendering."
What it does: CSS Containment tells the browser which elements have independent layout/paint, allowing it to skip unnecessary recalculations. content-visibility: auto can achieve 10× faster renders on long pages by virtualizing offscreen content.
The Three Types of Containment
/* Layout Containment: Element's internal layout doesn't affect external layout */
.card {
  contain: layout;
}
/* Browser won't recalculate parent/sibling layout when .card's children change */

/* Paint Containment: Element's painting is clipped to its bounds */
.sidebar {
  contain: paint;
}
/* Browser won't paint descendants outside bounds, creates stacking context */

/* Size Containment: Element's size doesn't depend on children */
.fixed-container {
  contain: size;
  width: 300px;
  height: 200px;
}
/* Browser won't measure children to determine container size */

/* Strict Containment: All of the above */
.isolated-widget {
  contain: strict;  /* layout + paint + size */
}

/* Content Containment: Layout + Paint (most common) */
.component {
  contain: content;  /* layout + paint (not size) */
}
The Power Combo: content-visibility
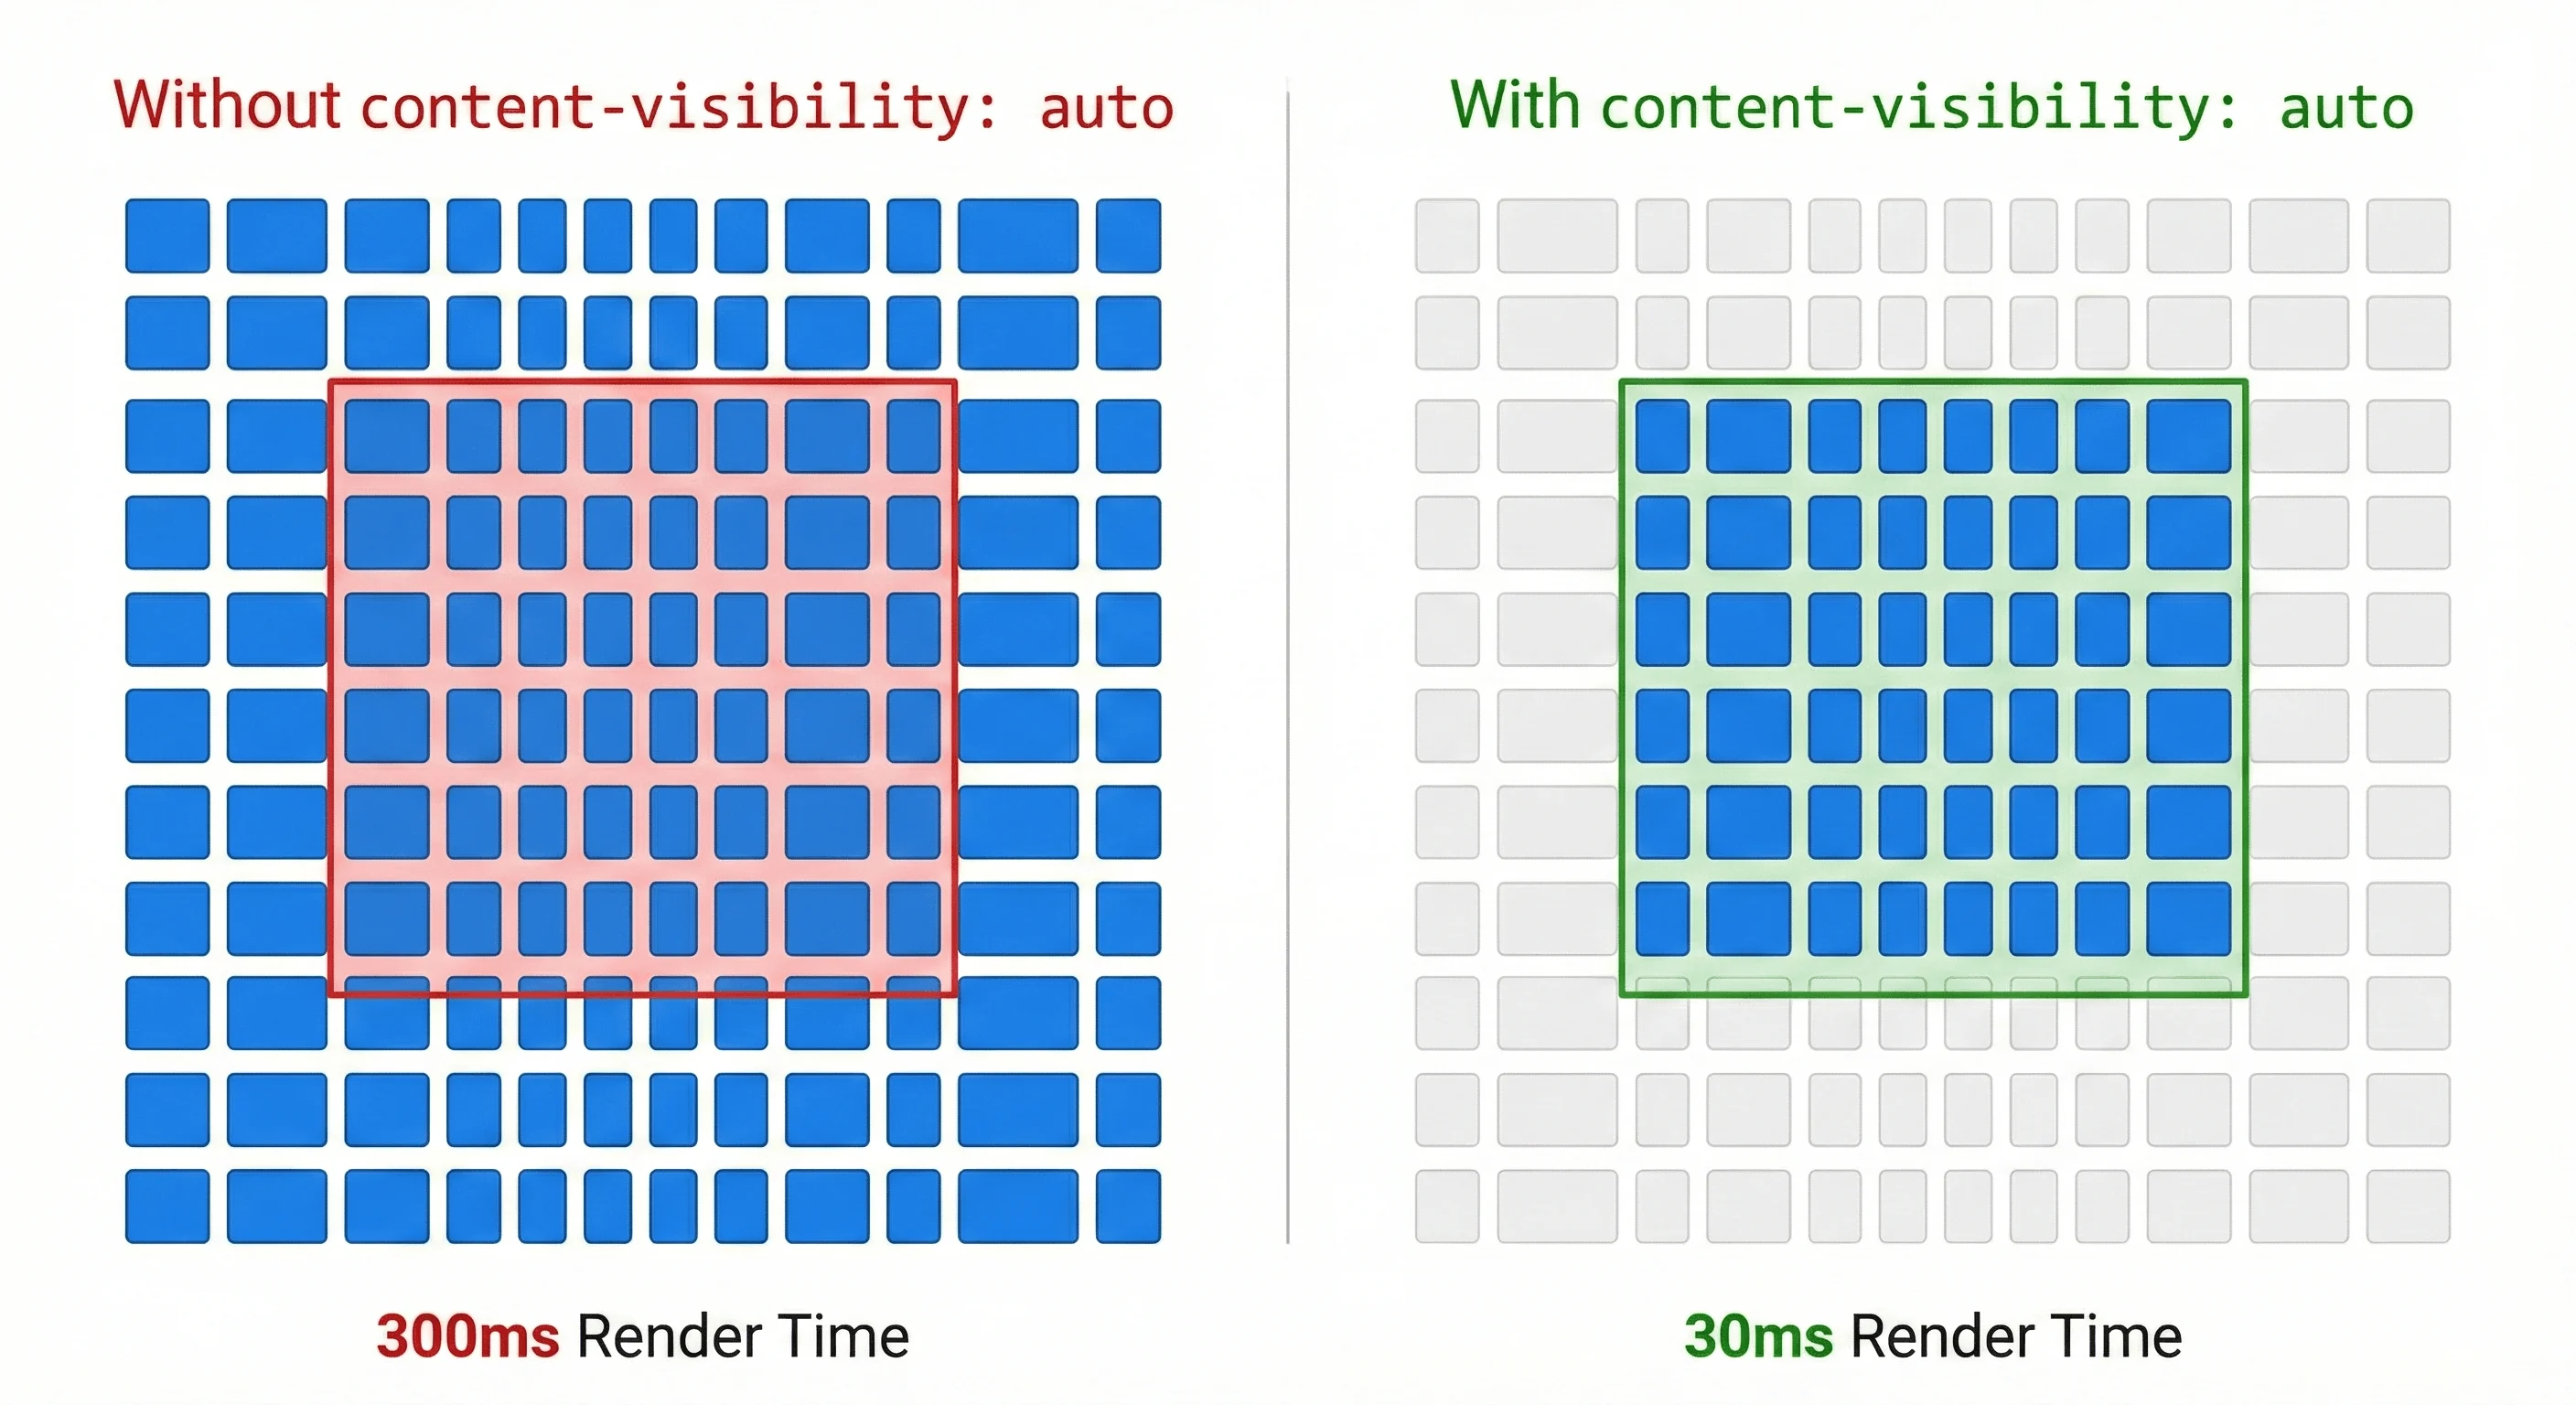
content-visibility is the nuclear option for offscreen content:
/* Auto-virtualizes offscreen content */
.article-section {
  content-visibility: auto;  /* Browser skips rendering when offscreen */
  contain-intrinsic-size: auto 500px;  /* Hint for layout before rendering */
}

/* Result on a 100-section article:
   - Without: Browser renders all 100 sections (300ms layout)
   - With: Browser renders only visible ~3 sections (30ms layout)
   - 10× faster initial render
*/
How content-visibility: auto Works:
- Offscreen: Browser skips Style, Layout, Paint entirely. Element occupies space based on
contain-intrinsic-size. - Nearing Viewport: Browser pre-renders the element ~1 viewport before it enters (smooth scrolling).
- Onscreen: Fully rendered.
- Leaves Viewport: Content destroyed after delay, returns to intrinsic size.
Real-World Impact:
<!-- Before: 100 cards, all rendered (500ms Layout + 200ms Paint) -->
<div class="grid">
  <div class="card">...</div>
  <div class="card">...</div>
  <!-- ... 98 more ... -->
</div>

<!-- After: Only visible cards rendered (50ms Layout + 20ms Paint) -->
<div class="grid">
  <div class="card" style="content-visibility: auto; contain-intrinsic-size: 300px;">...</div>
  <div class="card" style="content-visibility: auto; contain-intrinsic-size: 300px;">...</div>
  <!-- ... 98 more (not rendered until near viewport) ... -->
</div>
When to Use Each Type
| Property | Use Case | Example |
|---|---|---|
contain: layout |
Components whose internal layout is independent | Modals, tabs, accordions |
contain: paint |
Elements that should never paint outside bounds | Carousels, image galleries |
contain: size |
Fixed-size containers (rare, breaks intrinsic sizing) | Rare (use only with explicit width/height) |
contain: content |
Reusable components, widgets | Cards, list items, sidebar sections |
content-visibility: auto |
Long lists, infinite scroll, article sections | Blog posts, feeds, data tables |
DevTools Audit
Chrome DevTools → Rendering tab (cmd/ctrl-shift-P / Show Rendering) → Enable "Layout Shift Regions" and "Paint flashing"
- Green flash = Paint occurred
- Many flashes on scroll = Missing containment
- Add
contain: contentto reduce unnecessary paints
**To recap:**
contain: layoutisolates internal layout changescontain: paintclips rendering to boundscontain: content= layout + paint (most common use)content-visibility: autovirtualizes offscreen content- Use on components, cards, list items, and long sections
Performance Diagnostic Checklist
Common rendering issues categorized by root cause:
Main Thread Issues
Layout Thrashing
- Symptom: Animations stutter despite fast JavaScript
- Fix: Batch reads before writes. Use
transformnotwidth - DevTools: Look for purple "Layout" bars
Forced Sync Layout
- Symptom: Long "Recalculate Style" or "Layout" tasks
- Fix: Never read geometry (
offsetHeight) after DOM writes - DevTools: Use FastDOM library or batch operations
Main Thread Blocking
- Symptom: Interaction laggy (clicks/taps delayed), INP > 200ms
- Fix: Use
scheduler.yield()every 5ms or 50 iterations - DevTools: Yellow bars >50ms in Performance panel
Expensive Selectors
- Symptom: Slow style recalc (100ms+), especially on class changes
- Fix: Use BEM naming. Avoid universal selectors (
*) and deep combinators - DevTools: "Recalculate Style" taking >50ms
Long Layout Times
- Symptom: Layout takes 10-50ms on complex pages
- Fix: Add
contain: contentto components. Usecontent-visibility: auto - DevTools: Purple "Layout" bars taking >10ms
Commit Bottleneck
- Symptom: Compositor animations jank during JS execution despite using
transform - Fix: Use
scheduler.yield(). Reduce layer count (audit in Layers panel) - DevTools: "Commit" bars taking >2ms in Performance panel
Compositor Thread Issues
Blocking Compositor
- Symptom: Scroll jank on mobile; page feels "stuck" under finger
- Fix: Add
{ passive: true }to alltouchstart,touchmove,wheellisteners - DevTools: "Scroll" events blocking in Performance panel
JS Scroll Effects
- Symptom: Parallax/scroll animations desynchronized, header hides with delay
- Fix: Migrate to CSS
animation-timeline: scroll() - DevTools: JS scroll handlers firing frequently
GPU/Rasterization Issues
Excessive Rasterization
- Symptom: High GPU usage, battery drain, fan noise during animations
- Fix: Never animate
box-shadow,filter: blur(). Use texture baking - DevTools: Green "Paint" and "Rasterize" bars every frame
Layer Explosion
- Symptom: White flashes (checkerboarding), memory pressure, crashes on mobile
- Fix: Audit layers in DevTools. Remove unnecessary
will-change - DevTools: Layers panel shows >50 layers, high VRAM usage
Checkerboarding
- Symptom: White/gray tiles during fast scroll or pinch-zoom
- Fix: Add
will-change: transformsparingly. Reduce layer count - DevTools: White flashes visible during scroll
DevTools Workflow: Diagnose in 3 Steps
Step 1: Record Performance Profile (2 minutes)
Actions:
- DevTools → Performance → Record (Cmd+E)
- Interact with page for 3-5 seconds
- Stop recording
Look for:
- Red corners on tasks = Dropped frames (>50ms)
- Yellow bars = Your JavaScript
- Purple bars = Layout/Style
- Green bars = Paint/Rasterize
Diagnostic Pattern:
❌ BAD: [JS 60ms] → [Layout 40ms] = 100ms (12 dropped frames)
✅ GOOD: [JS 3ms] [Compositor 1ms] = 4ms (smooth)
Step 2: Audit Layers (Compositor Health Check)
Actions:
- DevTools → More Tools → Layers
- Rotate 3D visualization
- Click layers to see compositing reasons
Look for:
- Layer count: >50 on mobile = danger zone
- VRAM usage: aim for <500MB total on mobile
- Compositing reasons:
- ✅ "Active CSS animation" = Good (temporary)
- ❌ "Has will-change hint" on 30 layers = Layer explosion
Fix: Remove will-change from non-animating elements.
Step 3: Enable Visual Debugging (Real-time Feedback)
Actions:
- DevTools → Rendering tab
- Enable these checkboxes:
Paint Flashing (Green)
- Green flash = Area repainted
- Flash on scroll = Missing
contain: content
Layout Shift Regions (Blue)
- Flashing blue = Forced Synchronous Layout
- Fix: Add
content-visibilityor batch DOM operations
Layer Borders (Yellow/Orange)
- Yellow = Composited layers
- Orange = Expensive Paint Ops
Frame Rendering Stats
- Real-time FPS counter
Bonus: Coverage Tab (Remove Unused Code)
Actions:
- DevTools → More Tools → Coverage
- Record, interact, stop
- Identify unused CSS/JS
📊 Impact: Reducing CSS from 500KB → 50KB can cut Style recalc from 50ms → 5ms.
Core Web Vitals Impact
These optimizations directly improve your metrics:
| Optimization | INP Impact | CLS Impact | LCP Impact |
|---|---|---|---|
scheduler.yield() |
✅✅✅ Major (reduces input delay) | - | - |
contain: content |
✅ Moderate | ✅✅ Major (prevents layout shifts) | ✅ Moderate (faster render) |
content-visibility: auto |
✅ Moderate | ✅✅ Major | ✅✅✅ Major (10× faster LCP on long pages) |
animation-timeline: scroll() |
✅✅ Major | ✅ Moderate | - |
| Transform over Layout props | ✅✅ Major | ✅✅ Major | - |
| Passive event listeners | ✅✅ Major | - | - |
When NOT to Optimize
Avoid premature optimization. Not every component needs these techniques:
Green Flags (Optimize These):
- ✅ Animations or interactions users trigger repeatedly (scroll, drag, hover)
- ✅ Pages with >100 DOM nodes that animate or update frequently
- ✅ Mobile experiences where INP > 200ms or scroll jank is visible
- ✅ Components that cause visible paint flashing or layout shifts in DevTools
Red Flags (Don't Optimize These):
- ❌ One-time page transitions that already feel smooth
- ❌ Components that users interact with <1% of the time
- ❌ Static content with no animations
- ❌ Optimizing for 240Hz when your users have 60Hz displays
The Principle: Measure first (Performance panel), optimize second. If your INP is <100ms and you hit 60fps, invest time in features, not micro-optimizations.
The Cost of Over-Optimization
/* ❌ Over-engineered: */
.simple-button {
  contain: strict;
  will-change: transform, opacity;
  content-visibility: auto;
  /* This is overkill for a button */
}

/* ✅ Appropriate: */
.simple-button {
  /* No containment needed - it's just a button */
}

/* ✅ Optimized where it matters: */
.infinite-scroll-card {
  content-visibility: auto;  /* Justified - 1000s of cards */
  contain-intrinsic-size: 300px;
}
Key Takeaways
The rendering pipeline goes Style → Layout → PrePaint → Paint → Layerize → Commit → Rasterize → Composite. Optimize by skipping early steps.
Property Trees (Transform, Clip, Effect, Scroll) enable Compositor-only animations. transform and opacity modify these trees without touching Layout/Paint.
The Compositor Thread is your performance guarantee. Keep it unblocked with { passive: true } listeners and compositor-only properties.
Use modern APIs: scheduler.yield() for Main Thread yielding, animation-timeline: scroll() for Compositor-driven scroll effects, content-visibility: auto for virtualizing offscreen content.
CSS Containment (contain: content) is the most underutilized performance primitive. Use it on every independent component.
Measure before optimizing. Use Performance panel, Layers panel, and Rendering tab to identify actual bottlenecks, not imagined ones.
Browser Support Matrix (2026)
| Feature | Chrome/Edge | Safari | Firefox | Production Ready? |
|---|---|---|---|---|
scheduler.yield() |
Chrome 129+, Edge 129+ | ❌ Not supported | 142+ | ⚠️ Limited (use fallback) |
scheduler.postTask() |
Chrome 94+, Edge 94+ | ❌ Not supported | 142+ | ⚠️ Limited (use fallback) |
animation-timeline: scroll() |
Chrome 115+, Edge 115+ | 26+ | 114+ (disabled, needs flag) | ✅ Yes (use fallback) |
animation-timeline: view() |
Chrome 115+, Edge 115+ | 26+ | 114+ (disabled, needs flag) | ✅ Yes (use fallback) |
contain |
Chrome 52+, Edge 79+ | 15.4+ | 69+ | ✅ Yes |
content-visibility |
Chrome 85+, Edge 85+ | 18.0+ | 125+ | ✅ Yes (graceful degradation) |
| Passive event listeners | Chrome 56+, Edge 79+ | 11.1+ | 49+ | ✅ Yes |
| CompositeAfterPaint | Chrome 88+ (default) | N/A (WebKit uses different architecture) | N/A | ✅ Yes (Chromium-only) |
Key:
- ✅ = Safe for production (with feature detection or graceful degradation)
- ⚠️ = Limited browser support (requires fallbacks, may not work in Safari)
- ❌ = Not supported
Feature Detection Examples:
// Check for scheduler.yield()
if ('scheduler' in window && 'yield' in scheduler) {
  await scheduler.yield();
}

// Check for scroll-driven animations
if (CSS.supports('animation-timeline: scroll()')) {
  // Use CSS scroll animations
} else {
  // Fallback to IntersectionObserver
}

// Check for content-visibility
if (CSS.supports('content-visibility: auto')) {
  element.style.contentVisibility = 'auto';
}
Further Reading
- Chrome Rendering Performance - Official Web.dev guide
- Compositing and Rendering in Blink - Deep dive into RenderingNG
- CSS Containment Spec - W3C specification
- Scheduler API - WICG proposal and documentation
Thank you for reading ❤️
Did you find this deep dive helpful?
This guide represents deep research, code analysis, and production experience, it's human-researched and written, though AI-assisted in formatting, structure and review. If you found it valuable or have feedback on technical accuracy, I'd genuinely appreciate hearing from you.
Please feel free to share this with your team or leave a comment below about your own experiences with rendering performance optimization.